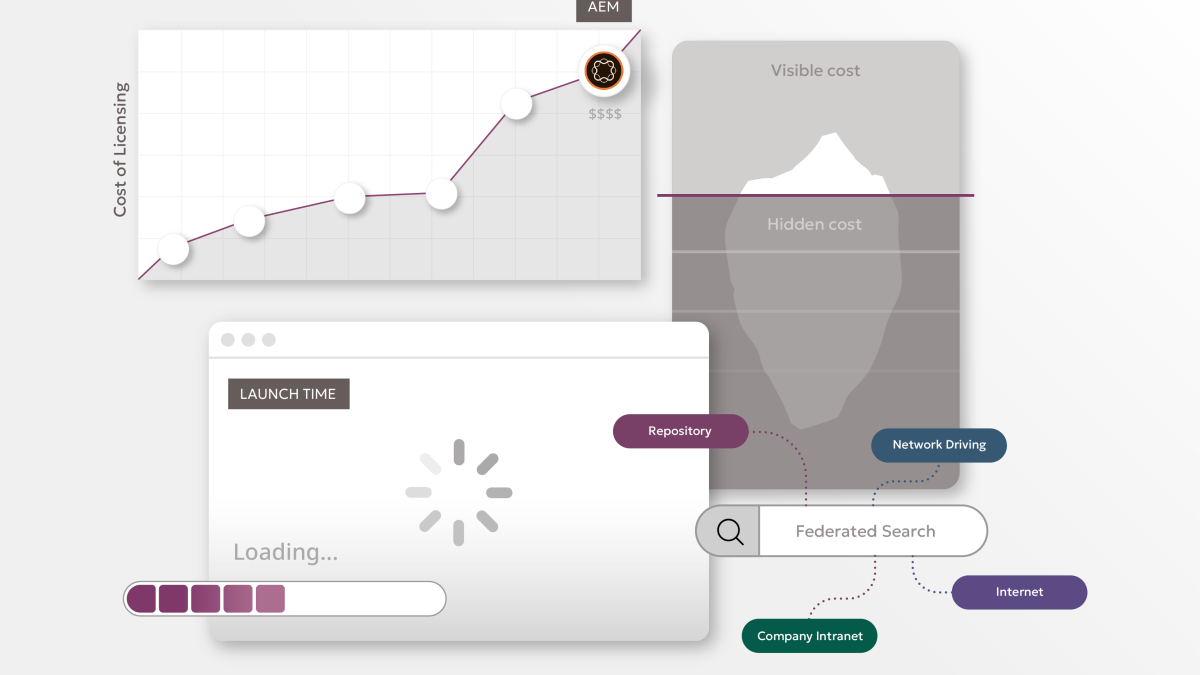
In enterprise environments, slow dashboards aren’t just an inconvenience they’re a liability.
Executives depend on Adobe Experience Manager (AEM) Insights Dashboards for real-time decisions. But when dashboards lag, stall, or display incomplete metrics, the ripple effects reach marketing, personalization, finance, and executive reporting.
If your AEM Insights Dashboard feels sluggish, the root cause is rarely “just load time.” It’s a signal often pointing to deeper structural or data pipeline issues.
In this article, we unpack the 7 most common performance bottlenecks and show you how to fix them without compromising scale, security, or reliability.
1. Overloaded Report Suites
Symptom: Dashboard queries timeout, reports take over 10 seconds to render, or you hit hit-volume warnings.
- A single global report suite trying to serve too many business units or markets may degrade over time.
- Daily data volume spikes, especially during campaigns, can overwhelm query performance.
Fix:
Split report suites logically or introduce virtual report suites with Adobe Customer Journey Analytics (CJA) to isolate workloads.
Executive Tip: Monitor your average query time weekly. Anything over 4–5 seconds for key metrics needs investigation.
2. Misconfigured Calculated Metrics
Symptom: Dashboards work, but freeze when filtering, segmenting, or adding time comparisons.
- Complex calculated metrics with nested IFs, custom formulas, or lookup references can throttle dashboard speed.
- Too many calculated metrics in a single panel compounds the problem.
Fix:
Audit and optimize formulas move reusable logic upstream where possible (via processing rules or segment definitions).
Executive Tip: Ask your analytics team for a “calculated metrics usage audit” quarterly simplification saves time and budget.
3. Bloated Segment Definitions
Symptom: Dashboards work in default view but lag or break when applying segments.
- Overly complex audience segments with multiple AND/OR/EXCLUDE conditions or time-bound rules can overload queries.
- Nested segment logic referencing other segments adds processing weight.
Fix:
Flatten segment logic and avoid chaining segments where possible. Pre-process key audiences into persistent segments in Audience Manager.
Executive Tip: Limit executive dashboard views to <5 pre-approved segments to ensure real-time usability.
4. Data Layer Inconsistencies
Symptom: Certain events or components appear delayed or are missing altogether in dashboards.
- Inconsistent or broken data layer implementations (especially across SPA, mobile, and legacy pages) can lead to dropouts.
- Tag misfires or missing variables delay data availability and weaken trend reliability.
Fix:
Run monthly audits with Adobe Debugger and ObservePoint across all templates and page types.
Executive Tip: Implement a rolling QA log of high-priority user journeys to track critical tracking gaps before they reach leadership dashboards.
5. Real-Time Data Dependency
Symptom: “Today’s” data doesn’t show up, or the dashboard only refreshes partially in real-time.
- Adobe Analytics standard processing is not real-time delays of 30–90 minutes are normal.
- Dashboards relying on real-time metrics (e.g. for campaign monitoring or personalization) often stall due to volume spikes.
Fix:
Use Real-Time Reports only for lightweight metrics. For executive dashboards, work off prior-day data with known latency tolerances.
Executive Tip: Set expectations across stakeholders. “real-time” isn’t always real-time, and that’s by design.
6. API Rate Limits or Broken Integrations
Symptom: Dashboards integrated with external data sources (CRM, CDP, BI) don’t load fully or show mismatches.
- Adobe Analytics API usage limits or stale credentials can block data refresh.
- Downstream systems may delay ingestion or block writes, creating a false picture.
Fix:
Set up automated alerts for API usage and integration failures. Ensure service accounts are rotated and monitored regularly.
Executive Tip: Ask your data team for a “critical path integration map” showing what systems feed into or depend on AEM dashboards.
7. Too Many Panels, Widgets, and Visuals
Symptom: Dashboards take too long to load or freeze entirely on scroll.
- Excessive visuals, breakdowns, and multi-panel comparisons stress browser memory and Adobe’s rendering engine.
- Often, dashboards evolve organically without retiring legacy components.
Fix:
Streamline. Use collapsible panels, fewer time frames, and focused visuals for each audience.
Executive Tip: Enforce a “1 dashboard = 1 decision” rule. If it’s not contributing to action, archive it.
Conclusion: Dashboards Should Empower, Not Obstruct
Slow dashboards are not just a UX problem they compromise trust, delay insights, and increase decision friction at the top.
By identifying and resolving these hidden bottlenecks, your AEM Insights environment can remain fast, scalable, and executive-ready just as your business demands.
Let Us Optimize Your AEM Dashboards for Performance and Scale
We specialize in AEM Analytics performance optimization, dashboard redesign, and cross-cloud data integration. Whether your reports are stalling or your leadership team needs fast, reliable executive dashboards—we bring both strategic and technical clarity.
📅 Book a 60-minute consultation to assess your dashboard performance, root causes, and quick wins.
[Schedule Your Executive Dashboard Review →]

